The basic things were
a. I needed to check execution times.
b. I didn't want to recompile my application or make changes to code.
I'd played around a bit with TPTP so I gave it a try and used it, it worked reasonably well, I eliminated some code that didn't cache data correctly , so all in all it was a success. I haven't had time to look through all the settings in detail , and I'm sure some of the settings are redundant , but they worked for me. I've created these steps using the latest available versions of TPTP/Eclipse.
I ran the test in Windows Vista. Folks using a different O.S. are probably smart enough to not need these steps.
Steps
a. Install Eclipse IDE for Java EE Developers
b. Install the TPTP(4.6.1) plugin. There are a set of screens on how to do this - http://wiki.eclipse.org/Install_TPTP_with_Update_Manager. You could also download the All in one which has Eclipse + TPTP. Also referred to a couple of links on TPTP. Profiling J2SE 5.0 based applications and TPTP installation guide
c. Download the agent controller for TPTP. Unzip it to a folder. Call this folder $AGENT_CONTROLLER_HOME
d. Set a new environment variable
JAVA_PROFILER_HOME=$AGENT_CONTROLLER_HOME\plugins\org.eclipse.tptp.javaprofiler
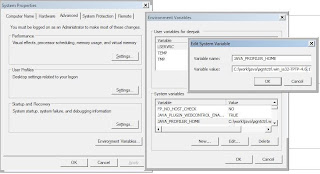
e. Set up the PATH ( I did this in Control Panel --> System --> Advanced --> Environment variables)
$AGENT_CONTROLLER_HOME\plugins\org.eclipse.tptp.javaprofiler;$AGENT_CONTROLLER_HOME\bin;
You should have Java in your path somewhere. I use the same JDK as that with BEA. (i.e. Java 1.5 . I did try Java 1.6, but it didn't work for me)
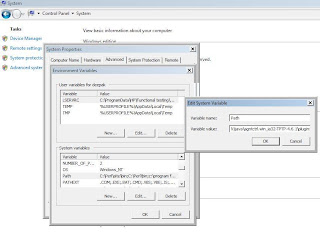
I run on Windows Vista so all command prompts are launched with Run As Administrator including the BEA server.
f. In a command window cd to $AGENT_CONTROLLER_HOME\bin and run setConfig. Specify the path to Java (1.5) and the other options, I chose the options in the screen below.

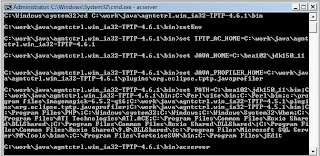
g. Start the agent controller (ensure no firewall blocking or unblock) by running acserver.exe.
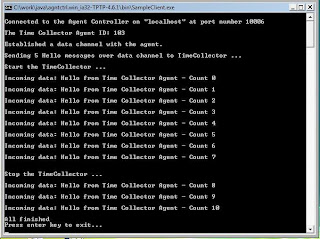
h. In a new command line window run SampleClient. If all is well, you should see the response. Close SampleClient command window but keep acserver running
Setting up BEA
i. Goto the BEA portal domain and change the following settings in setDomainEnv.cmd (these already exist , just change the values)
set debugFlag=false
set testConsoleFlag=false
set iterativeDevFlag=false
...
set PRODUCTION_MODE=true
Towards the bottom of the file (4-5 lines from the bottom), add the command to enable the profiler
set JAVA_OPTIONS=%JAVA_OPTIONS%
set JAVA_OPTIONS=-agentlib:JPIBootLoader=JPIAgent:server=controlled,filters=$DOMAIN_HOME\filters.txt;CGProf:execdetails=true %JAVA_OPTIONS%
Here we specify that the process should wait (server=controlled) till we connect to it, specify some filters for packages that we have no interest in (and which would cause the system to be slower), specify that we want to capture executing details.
Create a file named filters.txt in the path you have specified
org.apache.* * EXCLUDE
com.bea.* * EXCLUDE
weblogic.* * EXCLUDE
netscape.* * EXCLUDE
antlr.* * EXCLUDE
com.octetstring.* * EXCLUDE
com.rsa.* * EXCLUDE
org.omg.* * EXCLUDE
javelin.* * EXCLUDE
kodo.* * EXCLUDE
org.opensaml.* * EXCLUDE
com.pointbase.* * EXCLUDE
serp.* * EXCLUDE
com.solarmetric.* * EXCLUDE
schemacom_bea_xml.* * EXCLUDE
com.asn1c.* * EXCLUDE
com.certicom.* * EXCLUDE
When I hadn't filtered out kodo packages , I did get a ClassFormatError so at a minimum these packages must be filtered
j. Now run startWeblogic. The process should wait(we specified server=controlled remember)
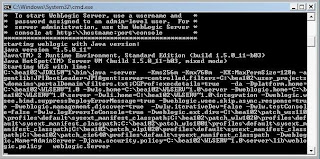
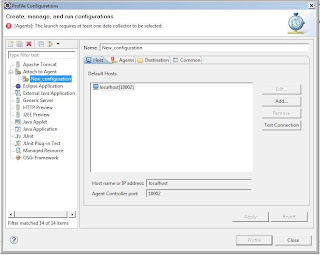
k. Now start eclipse. Click Run --> Profile Configurations. Click Attach to Agent and hit new icon. A new Configuration is created
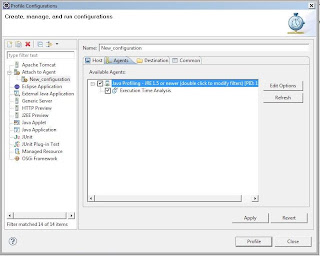
l. Now click the agents tab, if all is well you should be able to see an entry
m. Double Click it and specify the filters (same as the ones specified in filters.txt)
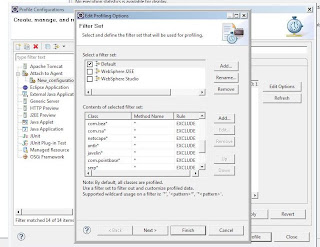
n. Click Next, Uncheck the run automatically, Click finish.
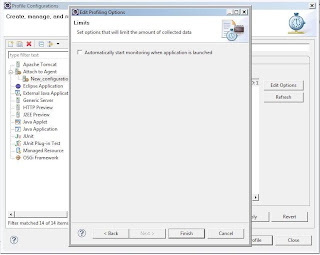
o. Click Apply and Profile. Switch to the profile perspective.
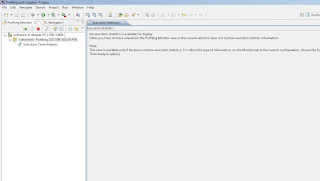
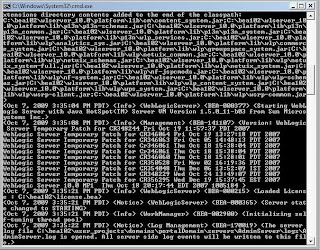
We haven't started profiling yet, but the Weblogic server will now continue start up. You probably have to wait about 10 minutes.
p. Once Weblogic is in running mode , you can start the profiling by clicking the run icon in the left pane. You can also click the execution statistics (though this might be empty since we have filtered most of the default BEA code that runs.
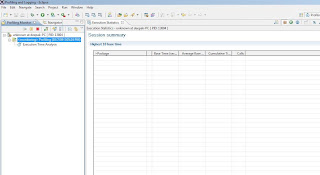
q. Now exercise your application by accessing it in the browser or by running a test e.g. a JMeter test.
You should now be able to see execution details in Eclipse. For e.g.
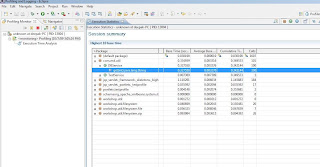
which shows 100 calls being made to DBService. Double click it.
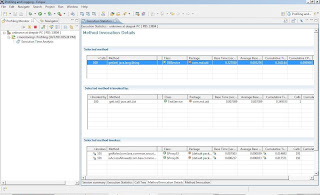
which shows the method calling it (TestService.getList() 1 call here makes a 100 calls to the DB , plus some BEA security checks). The TestService is called by the Portlet Controller as shown
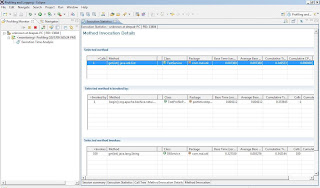
And you can easily conclude that there is some sort of N+1 problem here. A single request leads to 100 db calls, after which inspect the code fix the problem, rerun the profile and verify that you only invoke the DB once.
However there is a caveat here, it is far far easier to profile your code out of container. If you can separate out your code so that most of it runs outside Weblogic , then it's easier to profile it. And as we all know, this isn't always possible.