Thursday, December 31, 2009

Graphs for JMeter (parsing JMeter result logs)

Edit : Latest experiments with JMeter and graphs http://theworkaholic.blogspot.com/2015/05/graphs-for-jmeter-using-elasticsearch.html
One of the few features lacking in JMeter is when you run the tests from the command line, the out of box reports are restricted to a stylesheet that generates a summary report.
There are workarounds, you could load the result into Excel (small files) , or you could parse the log file and use JFreeChart to generate the graphs which is what I did. See examples
The following is an explanation of the mechanisms I used. These are probably not going to be out of the box , but hopefully they will be useful to someone who can customise it. The samples are also meant to be used by developers, so if you are a Tester with little or no coding experience, get a developer from your team to help.

I haven't looked closely at the JMeter parsing details, but you don't need to the details to use the JMeter classes (which in my opinion is a hallmark of a well designed system). There are two important files , the saveservice.properties and jmeter.properties which I have copied to a different location from the JMeter home so that I could modify them if I needed to.

The basic code for parsing using JMeter classes(using the JMeter API) is
SaveService.loadTestResults(FileInputStream, ResultCollectorHelper);
where ResultCollectorHelper is passed a Visualizer. The Visualizer has one method that is important to us
add (SampleResult sampleResult)
The Visualizer interface is a simple strategy that can be implemented as we want. Since we also want to write some graphs, I created a new interface called OfflineVisualizer which adds a single method
public Object writeOutput() throws IOException
Here is the class diagram (generated using FUJABA)


Visualizer is a simple strategy pattern. I've some sample implementations for LineChartVisualizer, StackedBarChartVisualizer, MinMaxAvgGraphVisualizer respectively to draw a line chart for each response, a Stacked chart (latency plus response) or a line chart showing Min,Max, Avg along with the response time.

If we take a quick look at the LineChartVisualizer code , its pretty straightforward, it simply uses the JFreeChart API and populates the data from the SampleResult. Note that the line chart objects would use memory proportional to the number of samples
//adds a sample. JFreechart uses a TimeSeries object into which we set each data item
public void add(SampleResult sampleResult) {
String label = sampleResult.getSampleLabel();
TimeSeries s1 = map.get(label);
if (s1 == null) {
   s1 = new TimeSeries(label);
   map.put(label, s1);
}
long responseTime = sampleResult.getTime();
Date d = new Date(sampleResult.getStartTime());
s1.addOrUpdate(new Millisecond(d), responseTime);
}
//uses JFreeChartAPI to write the data into an image file
public Object writeOutput() throws IOException {
TimeSeriesCollection dataset = new TimeSeriesCollection();
for (Map.Entry<String, TimeSeries> entry : map.entrySet()) {
   dataset.addSeries(entry.getValue());
}
JFreeChart chart = createChart(dataset);
FileOutputStream fos = null;
try {
   fos = new FileOutputStream(fileName);
   ChartUtilities.writeChartAsPNG(fos, chart, WIDTH, HEIGHT);
} finally {
   if (fos != null) {
       fos.close();
   }
}
return null;
}
//use the JFreeChart API to generate a Line Chart
private static JFreeChart createChart(XYDataset dataset) {
JFreeChart chart = ChartFactory.createTimeSeriesChart("Response Chart", // title
       "Date", // x-axis label
       "Time(ms)", // y-axis label
       dataset, // data
       true, // create legend?
       true, // generate tooltips?
       false // generate URLs?
       );

chart.setBackgroundPaint(Color.white);
XYPlot plot = (XYPlot) chart.getPlot();
plot.setBackgroundPaint(Color.lightGray);
plot.setDomainGridlinePaint(Color.white);
plot.setRangeGridlinePaint(Color.white);
plot.setAxisOffset(new RectangleInsets(5.0, 5.0, 5.0, 5.0));
plot.setDomainCrosshairVisible(true);
plot.setRangeCrosshairVisible(true);
XYItemRenderer r = plot.getRenderer();
if (r instanceof XYLineAndShapeRenderer) {
   XYLineAndShapeRenderer renderer = (XYLineAndShapeRenderer) r;
   renderer.setBaseShapesVisible(true);
   renderer.setBaseShapesFilled(true);
   renderer.setDrawSeriesLineAsPath(true);
}
DateAxis axis = (DateAxis) plot.getDomainAxis();
axis.setDateFormatOverride(new SimpleDateFormat("dd-MMM-yyyy HH:mm"));
return chart;
}

We can change the data some graphs show by using the Decorator pattern. One decorator LabelFilterVisualizer is shown.

/**
* decorates the visualizer by filtering out labels
*/
public void add(SampleResult sampleResult) {
 boolean allow = labels.contains(sampleResult.getSampleLabel());
 if (!pass) {
     allow = !allow;
 }
 if (allow) {
     visualizer.add(sampleResult);
 }
}

/**
* delegates to the decorated visualizer
*
* @return whatever the decorated visualizer returns
*/
public Object writeOutput() throws IOException {
 return visualizer.writeOutput();
}

This class filters out labels and only delegates those that satisfy the criteria. The writing of the image is delegated to the decorated OfflineVisualizer
We can also use the composite pattern(CompositeVisualizer) to have multiple graphs generated with a single pass through the result log file.

/**
* adds the sample to each of the composed visualizers
*/
public void add(SampleResult sampleResult) {
  for (OfflineVisualizer visualizer : visualizers) {
      visualizer.add(sampleResult);
  }

}

/**
* @return a List of each result from the composed visualizer
*/
public Object writeOutput() throws IOException {
  List<Object> result = new ArrayList<Object>();
  for (OfflineVisualizer visualizer : visualizers) {
      result.add(visualizer.writeOutput());
  }
  return result;
}


Finally we can use all the above to process multiple files , for e.g. when we want to show trends across multiple runs with varying thread counts.

/**
* parses each file
*
* @throws Exception
*/
public void parse() throws Exception {
  // One day we might multithread this
  for (String file : files) {
      ResultCollector rc = new ResultCollector();
      TotalThroughputVisualizer ttv = new TotalThroughputVisualizer();
      visualizers.add(ttv);
      ResultCollectorHelper rch = new ResultCollectorHelper(rc, ttv);
      XStreamJTLParser p = new XStreamJTLParser(new File(file), rch);
      p.parse();
  }
}

/**
* Gets the resulting throughput from each file and combines them
*
* @return always returns null
* @throws IOException
*/
public Object writeOutput() throws IOException {
  XYSeries xyseries = new XYSeries("throughput");
  for (AbstractOfflineVisualizer visualizer : visualizers) {
      Throughput throughput = (Throughput) visualizer.writeOutput();
      xyseries.add(throughput.getThreadCount(), throughput
              .getThroughput());
  }
  XYSeriesCollection dataset = new XYSeriesCollection();
  dataset.addSeries(xyseries);
  JFreeChart chart = createChart(dataset);
  FileOutputStream fos = null;
  try {
      fos = new FileOutputStream(fileName);
      ChartUtilities.writeChartAsPNG(fos, chart, WIDTH, HEIGHT);
  } finally {
      if (fos != null) {
          fos.close();
      }
  }
  return null;
}


Here's a sample that I ran. A single thread hits 3 pages on the apache website in a loop.


Response times are plotted against each label (without considering the thread).
File f = new File(JMETER_RESULT_FILE);
ResultCollector rc = new ResultCollector();
LineChartVisualizer v = new LineChartVisualizer(OUTPUT_GRAPH_DIR + "/LineChart.png");
ResultCollectorHelper rch = new ResultCollectorHelper(rc, v);//this is the visualizer we want
XStreamJTLParser p = new XStreamJTLParser(f, rch);
p.parse();
v.writeOutput(); //write the output


The next example filters out only the Component reference request and plots the response time, the minimum time, the maximum time and the average time for this request. You could extend this to indicate the median or the 90th percentile.

The code for this graph is
File f = new File(JMETER_RESULT_FILE);
ResultCollector rc = new ResultCollector();
MinMaxAvgGraphVisualizer v = new MinMaxAvgGraphVisualizer(OUTPUT_GRAPH_DIR + "/MinMaxAvg.png");
String[] labels = {"Component reference"}; //we only want this label
LabelFilterVisualizer lv= new  LabelFilterVisualizer(Arrays.asList(labels), v);//decorate the MinMaxAvgGraphVisualizer
ResultCollectorHelper rch = new ResultCollectorHelper(rc, lv);//use the decorated visualizer
XStreamJTLParser p = new XStreamJTLParser(f, rch);
p.parse();
lv.writeOutput();//write it out

The next chart shows a stacked chart which splits the response time for the Component reference into latency and the rest of the time.

File f = new File(JMETER_RESULT_FILE);
ResultCollector rc = new ResultCollector();
StackedBarChartVisualizer v = new StackedBarChartVisualizer(OUTPUT_GRAPH_DIR + "/StackedBarChart.png");
String[] labels = {"Component reference"};//we only want this label
LabelFilterVisualizer lv= new  LabelFilterVisualizer(Arrays.asList(labels), v);//Decorate the StackedBarChartVisualizer
ResultCollectorHelper rch = new ResultCollectorHelper(rc, lv);
XStreamJTLParser p = new XStreamJTLParser(f, rch);
p.parse();
lv.writeOutput(); //write the output


We could also run all these graphs at the same time using the Composite

File f = new File(JMETER_RESULT_FILE);
ResultCollector rc = new ResultCollector();
LineChartVisualizer lcv = new LineChartVisualizer(OUTPUT_GRAPH_DIR + "/AllLineChart.png");
StackedBarChartVisualizer sbv = new StackedBarChartVisualizer(OUTPUT_GRAPH_DIR + "/AllStackedBarChart.png");
MinMaxAvgGraphVisualizer mmav = new MinMaxAvgGraphVisualizer(OUTPUT_GRAPH_DIR + "/AllMinMaxAvg.png");
String[] labels = {"Component reference"};
LabelFilterVisualizer lv= new  LabelFilterVisualizer(Arrays.asList(labels), sbv);//decorate
LabelFilterVisualizer lv2= new  LabelFilterVisualizer(Arrays.asList(labels), mmav);//decorate
OfflineVisualizer[] vs = {lcv, lv,lv2};//use these 3 visualizers
CompositeVisualizer cv = new CompositeVisualizer(Arrays.asList(vs));//create a composite
ResultCollectorHelper rch = new ResultCollectorHelper(rc, cv);
XStreamJTLParser p = new XStreamJTLParser(f, rch);
p.parse();
cv.writeOutput();//the composite will delegate to each visualizer


I also reran the same test for 1, 3,5,7 and 10 threads. Using the classes above and a new throughput visualizer (where I calculate throughput as total number of requests / total time the test ran) and plotted the throughput v/s the number of threads


String [] files = {JMETER_RESULT_DIR + "/OfflineGraphs-dev-200912311310.jtl", JMETER_RESULT_DIR + "/OfflineGraphs-dev-200912311312.jtl",JMETER_RESULT_DIR + "/OfflineGraphs-dev-200912311315.jtl",JMETER_RESULT_DIR + "/OfflineGraphs-dev-200912311316.jtl",JMETER_RESULT_DIR + "/OfflineGraphs-dev-200912311318.jtl"};
MultiFileThroughput mft = new MultiFileThroughput(Arrays.asList(files),OUTPUT_GRAPH_DIR + "/Throughput.png");
mft.parse();
mft.writeOutput();


The above examples are not exhaustive and probably wont work for you (for e.g. threads are ignored, thread groups are ignored, and these might have meaning for your test). However you should be able to use this to write your own implementation.

Running the code.
a. Download the code. This is an eclipse workspace. To get this to compile, you need to define two variables in eclipse (JMETER_HOME and JFREECHART_HOME) for the classpath. Modify config.properties to whatever is applicable for your system. Use GraphClient to see the samples
I created an additional dummy directory for Jmeter home and created a bin directory under it and copied jmeter.properties and saveservice.properties.
b. Change the client to use the visualizers you want. The sample client should give you some idea. Or create a new visualizer
c. Compile and run! If you use a different IDE or want to use ANT it should be pretty straight forward. The source code has been written and tested on Java 1.5 . There isn't any 1.5 feature I use except generics and the new for loop syntax. You could change this to be 1.4 compatible.

Further work
a. Combining results from multiple files into a single run.
b. Making the visualizers configurable
c. Canned HTML reports
d. Threads/ThreadGroups
e. Determine limits for the graphs.
f. Support custom attributes


If there are specific graph requests , I might take a look into it, day job and wife willing.

Wednesday, December 16, 2009

JMeter and SLA's

One of the current issues on our site is that while we profiled and performance and load tested the important pages before we went live, we haven't done it for subsequent builds and releases. There are various excuses for this (lack of time, lack of representative environments, restrictions on the actions that may be performed because the site is live), none of them really justified. However no matter how much you test the site before hand, the site may still malfunction, perhaps transiently on production. For e.g. we sometimes got timeout errors between 6:00 to 10:00 a.m. (it was eventually determined to be a Database index compacting job that was creating trouble). The problem is that we had to be reactive, look at the logs, there was a timeout, run around like headless chickens because the site was working fine now, no access to the environment to see whats happening etc. Now we could have configured logs to automatically notify us when there are errors but this would only work if there was a timeout (in our 60 seconds for any remote operation). If a page that normally takes 2 seconds to load took anything under 60 seconds we would not see errors.
In previous projects , we had OVIS, which I believe is expensive, but my current project has no such commerical tool. Open source tools all seem to solve parts of the problem , but there didn't seem to be any tool that did everything I wanted.
Briefly
a. Flexible schemes to measure response times. We needed to be able to simulate accessing stand alone urls, login flows, checkout flows, search flows.
b. Ability to store the data and view trend graphs
c. Ability to run the tests on a schedule
d. Ability to specify thresholds for each page (again with a fair degree of flexibility) and mark responses as failed
e. Flexible notification schemes

The choice of technologies I used were based more on things I wanted to learn or refresh rather than the best there is, so keep in mind this is more of a toy than I would have liked
a. JMeter for response times. I'm not really interested in loading the site, nor do I want exact browser render times, I'm just looking for ballpark numbers and deviations, especially after builds or at odd hours.
b. Hudson for scheduling Jmeter builds. I chose hudson because I haven't used it before.
c. STAX for parsing JTL. I chose stax because I wanted to be able to parse large files, and i already know SAX , but I've never used STAX.
d. Tomcat with JSP + Spring. I've loved Spring JDBC ever since I've used it (take that Hibernate, JPA, JDO, EJB). It removes all the redundant code while not sacrificing the power of SQL , and there is no learning curve beyond Spring. I chose JSP over any of the MVC framework because of shortage of time. While people may insist how their preferred framework saves them tons of time , this only applies in the long run
e. JQuery for all the javascript stuff
f. JFreeChart for the chart related functionality. I've used this before and found it to be a solid library.
g. Derby for the database, this is something I have not used before, I wanted a reasonably stable database , non embedded.

Most of the things Ive written aren't really reusable, in addition this was quick and dirty, so don't expect this to work for you
a. The JMeter Script
b. Parsing the JMeter Script and loading it into the database
c. Scheduling JMeter to run in Hudson
d. Writing a UI around this
e. Allowing administrators to configure thresholds and notifications
f. Notifications

Friday, November 20, 2009

Randomly Clicking links in JMeter (sometimes known as spidering)

A follow up to Spidering a site with JMeter
A user on the JMeter mailing list posted his solution using the HTML link parser[1] to spider a site. The spidering consists of clicking a link at random from the links parsed from the last accessed page.
The test looks like
Script available at Spider.jmx
The Initial Request is used by the HTML Link Parser to get the initial set of urls from which one will be chosen.
The While controllers condition is simply true , since we want it to loop forever.
The Spider HTTP Sampler has a path of .*.
The If Controller has a condition ${__javaScript(!${JMeterThread.last_sample_ok})}
This simply checks if the last sample fetched failed (by .* or because it fetched a CGI/PDF which cant be parsed for links and if so reexecutes the Initial Request.)
There are numerous tweaks you can implement , you might not execute the initial request, it might be one at random that you pick , or the last successful request. You might choose to check the request being made to restrict the paths.

Note that this clicks a link at random from a set of links acquired from the previously clicked page. This cannot ensure that a link is not repeated and cannot ensure that all links are fetched.

[1] http://jakarta.apache.org/jmeter/usermanual/component_reference.html#HTML_Link_Parser

Wednesday, November 11, 2009

Dependent tests in JMeter (kind of)

A common use case in testing is the concept of dependent tests(except for the unit test fanatics who love JUnit and didn't realise they needed this functionality till TestNG came along). One of the requirements then becomes that these dependent test should not execute if the test that it depends on fails. To implement this in JMeter we need to use the following two pieces of information
The variable JMeterThread.last_sample_ok is set to "true" or "false" after all assertions for a sampler have been run. [1]
If Controller -Evaluate for all children - Should condition be evaluated for all children? If not checked, then the condition is only evaluated on entry.[2]

Combining the two bits of information we have
Thread Group
If Controller((${JMeterThread.last_sample_
ok}) with Evaluate for all children = checked
Req 1 --> if this errors req 1 and req 2 wont be executed
Req 2 --> if this errors , req 3 wont be executed
Req 3
Note that any assertion failing would also mark the request as failed.
Note also that you cannot have nested dependent sets but you could flatten them out as separate IF controllers.

[1] http://jakarta.apache.org/jmeter/usermanual/component_reference.html#assertions
[2] http://jakarta.apache.org/jmeter/usermanual/component_reference.html#If_Controller

Friday, October 30, 2009

Commenting Code

Have you ever written code that reads from a BufferedReader? Suppose you read someone else's code that said

//There is a BufferedReader r
StringBuffer sb = new StringBuffer();
int i;
while ((i = r.read()) != -1)
sb.append((char)i);

What do you think ? will you change it to the more normal
int i;
char[] data = new char[1024];
while ((i = r.read(data,0,data.length)) != -1)
sb.append(data);
Edit: Embarassingly the above code is wrong, but the code is only illustrative , reading a character at a time v/s reading chunks of it

Which is more efficient? Which is more 'performant'?

And finally if you read the original code with an additional comment

StringBuffer sb = new StringBuffer();
int i;
// under JIT, testing seems to show this simple loop is as fast
// as any of the alternatives
while ((i = r.read()) != -1)
sb.append((char)i);
would you even bother?

Code snippet taken from ImportSupport.java - jakarta-taglibs-standard-1.1.2-src.

Thursday, October 29, 2009

Spidering a site with JMeter

Sometimes we need to check every link on the site and see that they all work, and this question came up a couple of times on the JMeter forum 'How do I use JMeter to spider my site?'
But before we go into the solutions, lets take a step back and see the reasons behind wanting to spider the site or skip to solution

a. You want to find out whether any urls respond with a 404. This isn't really a task for JMeter and there are various open source/free link checkers that one might use so there really isn't a need to run JMeter to solve this class of problems (http://java-source.net/open-source/crawlers for just spiders in Java. There are others too like Xenu or LinkChecker)

b. You want to generate some sort of background load and you hit upon this technique. A spider run with a specific number of threads will provide the load. While a valid scenario, this doesn't really simulate what the users are doing on the site. So it goes back to what are you trying to simulate?. It's much better to simulate actual journeys with representative loads. You might need to study your logs and your webserver monitoring tools to figure this out. It's tougher to do this, but it's more useful.

c. You want to simulate the behavior of an actual spider (like Google) and see how your site responds, whether all the pages are reachable. See a.

Other problems
A test without assertions is pretty much useless. A spidering test by its nature is difficult to assert (other than response code = 200! and perhaps the page does not contain the standard error message shown).

JMeter does not really provide good out of the box support for spidering. The documents refer to an HTML Link Parser which can be used for spiders which leads some users to try it out and complain that it doesn't work. It does(see this post) but not how you expect, and not as a spider (The reference manual needs to change).

Before we go on to trying to implement an actual Spider in JMeter, lets see some alternatives that we have (using JMeter and not a third party tool).
a. Most sites have a fixed set of URL's and a possible dynamic set e.g. a Product Catalog where each product maps to a row in the database. It is easy enough to write a query that fetches these (using a JDBC Sampler) and generating a CSV file that contains the URL's you want. The JDBC sampler is followed by a Thread Group (number of threads the spider will run) which reads each URL from the CSV. This is especially useful when you consider that it is quite possible that some links are not accessible from any other link in the site (This is bad site design, but exists , for e.g. FAQ are not browsable on my current site, they must be searched for which means that there is no URL from which the FAQ is linked to and a spider would never find them directly)

b. Some sites generate a sitemap (it may even be a sitemap that is used for Google) for the reasons mentioned above. It is trivial to parse this to obtain all the urls. A stylesheet can convert this into a CSV and the rest is the same as point a.

One last thing before we start discussing JMeter solutions. The first time I came to know anything about how spiders work is when I ran Nutch locally(and later refined with the knowledge of MapReduce).
In a simplified form
a. A first stage reads URLs that are pending from the buffer/queue and downloads the content. This is multithreaded but not too much so as to not bring down the site.
b. The second stage parses the contents for links and feeds it into the same buffer and queue.
c. A third stage indexes the content for search. This is irrelevant for our tests.
A related concept is that of depth. i.e. In how many clicks(minimum) does it take to reach the link from the root/home/starting point of the website.

Attempt 1.
Using the previous depth definition, most sites(because of menu's and sitemaps) need at the most 5-7 clicks to reach any page from the root page (kind of like Kevin Bacon's six degrees of separation). This implies that instead of a generic solution we could have a hardcoded solution which fixes the depth that we look at and use the time tested method of Copy - Paste.
Here's what this solution would like

The test plan is configured to run the Thread Groups serially
1. Thread Group L0 fetches all the urls listed in a file named L_0.csv. Each request is attached to beanshell listener which parses the response to extract all anchors and writes these anchors to a separate temp file. The code which does this is lifted from AnchorModifier and is accessed via a Beanshell script calling a Java class(JMeterSpiderUtil).
2. Thread Group L0 Consolidate (single thread) creates a unique set of all the urls from the temporary files created in step 1 and subtracts the urls already fetched from L_0.csv and writes these urls to a file named L_1.csv. This code is also in the Java class and is described below.
3. Thread Group L1 (multi thread) fetches all the urls listed in the file L_1.csv which was created in step. Each request is attached to beanshell listener which parses the response to extract all anchors and writes these anchors to a separate temp file.
4. Thread Group L1 Consolidate (single thread) creates a unique set of all the urls from the temporary files created in step 3 and subtracts the urls already fetched from L_0.csv,L_1.csv and writes these urls to a file named L_2.csv
... and so on for any number of levels/depths that you want.
If you are any sort of developer , you are probably groaning at the above. "Hasn't this guy heard about loops? What about maintaining these tests? Are we going to make any changes in 5 places ?".
We could use Module Controllers to reuse most of the test structure but it's still inelegant.
One of the reasons I've described the above is that even if the solution looks inelegant it is easy to understand and doesn't take time to implement, which means you can start testing your site pretty quickly. Note that your priority is the testing of the site , not the elegance of the testing script.

Attempt 2
Lets now see if we can increase the elegance of the script. One of the problems we run into is that the CSV data set config can't use variable names for the filename. Another problem is that in the solution above we run the Thread Groups serially and we use a single thread in a thread group to combine the results. If we want to use a single looped thread group we have to ensure only 1 thread does the combining which needs to wait for all the other threads to complete. You can probably simplify this solution by extending the CSV data set config or the looping controllers, I don't consider these approaches because I have no Swing experience at all , so the only ways I extend JMeter are via BeanShell or Java.
After some experimentation this is the solution that I've come up with


1. The Loop Controller controls the depth/level
2. The simple controller has an If controller that is only true for the thread with threadnumber 1. It defines the current level and copies the file L_${currentlevel}.csv to urls.csv
3. The wait for everyone is configured with a synchronizing timer (same as total number of threads in a threadgroup) so that all the threads are waiting till the first thread has finished in step 2
4. The while controller iterates over all the urls in the csv. The CSV Data Set is configured to read the copied urls.csv file (since we cannot make the name variable). What we will do in the subsequent steps is recreate this same file with new data. Each request is attached to beanshell listener which parses the response to extract all anchors and writes these anchors to a separate temp file. The code which does this is lifted from AnchorModifier and is accessed via a Beanshell script calling a Java class(JMeterSpiderUtil).
5. We have a copy of step 2 here, all the threads wait till everyone else is done (for that level only)
6. The If controller ensures that the consolidation is done only for the first thread, all the files written in step 4 are combined into a unique set, all the urls already processed are subtracted and a new file L_${nextlevel}.csv is written. Properties are set so that the ${currentlevel} now is the ${nextlevel} so that step 1 will now pick up this new file and copy it as urls.csv for the CSVDataSetConfig to pick up.
7. The Reset Property Bean Shell sampler is used to reset the CSV Data Set Config
FileServer server = FileServer.getFileServer(); // get the File Server
server.closeFiles(); // close everything
server.reserveFile("../spider/urls/urls.csv", null, "../spider/urls/urls.csv"); //reregister the CSV, we have chosen sharing mode as All Threads to avoid copying the alias name generation in CSVDataSet.java


This was run with a root of http://jakarta.apache.org/jmeter/index.html.
Only urls with jmeter in them were spidered and with the jakarta.apache.org host.
Level 1 - 17 urls
Level 2 - 29 urls
Level 3 - 125 urls
Level 4 - 833 urls
Level 5 - 2 urls
Level 6 - 0 urls
And I did get some failures too e.g.
http://jakarta.apache.org/jmeter/$next
http://jakarta.apache.org/jmeter/$prev
So I guess the test is successful because it found some issues!.
Which means there are no more urls that satisfy our criteria. You could change the loop to a while controller and use this condition to check whether or not the test should exit. However some sites generate unique urls (e.g. by appending a timestamp) which makes it possible that your test might not exit , so you should normally have a safety for maximum depth.

Is attempt 2 more elegant? Probably , but also less configurable and took about 2-3 days to get it working and needed some study of JMeter source code. Note that the previous solution could vary the number of threads available to each Thread Group but this can't. However by using the constant throughput timer , you can achieve variable throughput for different levels.

JMeterSpiderUtil.java
The major part of this code is from AnchorModifier
Important snippets are shown
if(isExcluded(fetchedUrl) ) //excludes stuff like PDF/.jmx files which cant be parsed
...
(Document) HtmlParsingUtils
.getDOM(responseText.substring(index)); // gets a DOM from the request
...
NodeList nodeList = html.getElementsByTagName("a"); //gets the links
...
HTTPSamplerBase newUrl = HtmlParsingUtils.createUrlFromAnchor( hrefStr, ConversionUtils.makeRelativeURL(result .getURL(), base)); //get the url
...
if(allowedHost.equalsIgnoreCase(newUrl.getDomain())) {
String currUrl = newUrl.getUrl().toString();
if(matchesPath(currUrl)) {
//currUrl = stripSessionId(currUrl);
//currUrl = stripTStamp(currUrl);
fw.write(currUrl + "\n");
}
}
//checks whether the host is the one we are interested in, whether the path is one that we want to spider, could strip out session ids or timestamp parameters in the url
...
Download Code
SpiderTest - Attempt 1.
SpiderTest2 - Attempt 2.
JMeterSpiderUtil - Java utility.

If you want to use the code
a. Ensure that the total number of Threads is specified correctly in both synchronizing timers (use a property)
b. Some directories are hardcoded. I used a directory named scripts under jmeter home, another directory called spider at the same level as scripts. Scripts has two sub directories temp and urls. L_0.csv the starting point is copied into urls.
c. If you want to rerun the test ensure you delete all directories under temp and all previously generated csv files in urls (except for L_0.csv.
d. You might have to change the java code to further filter urls /improve the code. The Jmeter path regular expression is hardcoded
e. You have to change the allowedHost , probably to an allowable list rather than a single value.
f. You probably have to honor robots.txt
g. You might want to check the fetch embedded resources or change what urls are considered to be fetched (currently only anchors no forms or ajax urls based on a pattern)

Note that the code is extremely inefficient and was only written to check if what I theorized in http://www.mail-archive.com/jmeter-user@jakarta.apache.org/msg27108.html was possible
There is a lot of work to properly parameterise this test , but hopefully this can get you started.

Code available here

Friday, October 23, 2009

Interview questions revisited

Ive been experimenting with webmaster tools and analytics for this blog, and while running a Google search , I came across
http://www.experts-exchange.com/Software/Server_Software/Application_Servers/Java/BEA_WebLogic/Q_24000475.html+weblogic+portal+interview+questions (Hint use Google Cache to see the answers )
And on the BEA forums I see
http://forums.oracle.com/forums/thread.jspa?threadID=919149&tstart=15
http://ananthkannan.blogspot.com/2009/08/weblogic-portal-interview-questions_29.html
http://venkataportal.blogspot.com/2009/09/comming-soon.html
Compared with my own
http://theworkaholic.blogspot.com/2007/02/weblogic-portal-interview-questions.html
http://theworkaholic.blogspot.com/2009/10/weblogic-portal-interview-questions-ii.html

There's a pretty big difference between the kind of questions I ask and the kind of questions people seem to think will be asked or indeed do ask. A multiple choice question? really? I guess that was picked up from the BEA certification exam. (The less said about certification the better). Is there a point asking people something that's right there in the documentation or something that any respectable search engine could?
Lets get some assumptions out of the way
a. A bad resource is extremely detrimental to any software project. The contribution is negative and a big negative at that. It is better to not have the resource than have a bad resource.
b. There isn't an easy way to eliminate a bad resource at a short listing phase.
In most cases there are more people applying to the job than there are jobs. The resume is too abused to be an effective eliminator. If you look at a typical Java/EE resume , every specification in the EE umbrella is covered. Everyone has solid knowledge and expertise in all the specifications. On project experience is sometimes faked.
Would a quick multiple choice easily corrected paper help? I believe that this is actually bad. The people who aren't that knowledgeable know it, and spend their time memorizing documents/api's etc before an interview and can probably game this test. The people who I know are good in their fields usually don't have much time or patience for the minutiae, but are quite capable of doing this on demand. Project Experience would be a good indicator, but it is costly to verify this before hand. References are usually given by friends and aren't reliable. Typically a interviewee isn't going to provide a reference to someone who will give him a negative review.

So we can't rely on the short listing process to eliminate the bad apples. You must as an interviewer go to an interview thinking that you might be gamed. This means that straightforward questions might be answered by a bad candidate. This doesn't mean that you should ask the brain teaser sort of questions which only indicate that the interviewee is good at solving brain teasers (or has Googled the answers).

What then constitutes a good interview question?
Here are my criteria
a. The interviewee must be able to describe what he has worked on /is working on effectively. he must be confident in the modules he has worked. He must be able to answer questions related to his module when you vary some of the parameters. This is a deal breaker. A person who doesn't know what his project probably wont be able to handle yours either.
b. Most of the technical questions I ask are conversational and to which there probably isn't a right answer. The question is just the opening gambit, E4 for chess players. If I feel I am getting a recitation from documents , I introduce a twist or change a parameter of the problem (e.g. if the answer is something like I would design this with Spring by utilizing Dependency Injection IOC pattern and use the Hibernate ... - would be met with sorry the spring/hibernate license doesn't meet the project requirements, you can't use it).
c. Hands on experience on the technologies Im looking for is always a great plus, but it isn't a dealbreaker for me. If you can handle JSP, you can handle JSF. If you can handle Struts, you can handle other controller frameworks. What I can't stand is when someone states about all the stuff he has worked on at the start, how he was the heart and soul of the entire project, the life of the party, later changes his tune to say well I didn't really work much on that particular part. Thats a deal breaker. Dishonesty means I can't trust any of the other wonderful things you said, bye bye.
d. Never ask code questions without also providing the books, the documents, the search engine and a compiler. Writing code snippets on a whiteboard is stupid. Pseudo code questions are perfectly acceptable. Don't ask people to reinvent sorting algorithms when there are so many books (When will I ever buy that Donald Knuth book) that they could use. If you want to check analytical skills then use real life examples. There must have been numerous problems with your project, describe the circumstances and ask the resource to make suggestions.

In some ways I'm glad that I don't have to conduct interviews anymore. The last time I was proudly telling my mother of how many people I have rejected, she said why am I depriving people from working , and that you don't know how much they might need the job. While I still stand by my assumption that no resource is better than a bad one, it's still disturbing to think that I might(probably) have made errors in judgement and maybe just maybe I rejected a deserving candidate and maybe just maybe he really needed it. Like I said I'm glad I don't make hire decisions anymore

Throughout this post, I have referred to the interviewee as 'him'. Thats probably due to that fact that more than 90% of the candidates I've interviewed are male. Which is a sad state of affairs for software.

Wednesday, October 21, 2009

First Weblogic Portal Pro


I'd like to thank.....This shouldnt give me that much happiness, but it does.

Tuesday, October 20, 2009

Weblogic Portal interview questions - II

The following are the Portal interview questions that ive used or kept or have been asked(in no particular order , and no answers either :) )
I do not include questions (e.g. what is a nested pageflow) that can be answered with Google.
Also see Weblogic Portal interview questions - I
  • What options do you have for Single Sign On for a Weblogic Portal application (and in general). Give the advantages and disadvantages of each approach
  • If you are using WSRP, and the user is logged in to the consumer , is he also logged into the producer? If so how? If not how do you do this?
  • If you have standard static HTML application, how would you optimise this for performance? For each of the technique's you mention , how would this be implemented in Weblogic Portal
  • How do you ensure that a Weblogic Portal application is easily Searchable by external search engines like Google
  • What are serious problems/ drawbacks of JSR 168/ JSR 286. Under what circumstances would you not use these for your portlet implementation? Under what circumstances would you use these for your portlet implementation?
  • Why is asynchronous desktop a bad idea? In what situations does it become a good idea?
  • What circumstances can cause issues with Portal Propagation. Would you use propagation in your actual production? If not , why not?
  • How would you integrate Flex / Any flash based widget into your portal application?

Monday, October 12, 2009

Detecting missing files with JMeter

I have lately found that JMeter is becoming my tool of choice for almost all the normal mundane programming tasks. Case in point.
On my current website's we have a bunch of PDF's (150K) which are accessible only via search and have an entry in some table for that purpose. Each PDF is linked to a language and multiple countries so the total number of rows in the database are much more than the number of files. Now years later, due to human error and other causes some of these records exist in the database but there aren't corresponding PDF files on the webserver , which allows the user to see a link when he searches for the data but a 404 error when the user actually clicks it. I had to generate a report listing all these files.

Constraints
a. Administrators wont let you run a program on the web server.
b. You could ask them to copy files to a separate directory but it takes about a week to get approval for anything related to production except for a Database copy (which is available immediately)

I initially thought of asking for a recursive file name print of all the files from the webserver to compare against the database (but writing this Java program would have taken half a day to iron out the bugs) . So I settled on JMeter

Run query to get a list of files and save it to a CSV (Squirrel SQL client)
Thread Group (10 in parallel)
CSV Data Set
Http Request (HEAD) , the web link to the PDF is read from the CSV

Run from command line with a sample_variables property set to fields from the CSV.
Time to run test = 1.5 hrs. JMeter's sample HTML was good enough to be shown to the users to fix the issues.
Whats great is that when the missing files are uploaded I can verify the data easily again.

Now I could have used JMeter's JDBC sampler to eliminate the Squirrel client.

Tuesday, October 06, 2009

Profiling BEA Weblogic Portal Apps

Profiling a portal application running on earlier versions of BEA Weblogic has always been somewhat painful(still is) if you aren't willing to pay for a commercial profiler(It still might be painful). With Weblogic 8.1 I had used Eclipse Colorer but that doesn't seem to work with the later versions of Eclipse and hasn't been developed in a while, it crashed on Weblogic 10 (JDK 1.5). I tried out a few from the Open Source Java Profilers page but some crashed the JVM and some didn't do what I want.
The basic things were
a. I needed to check execution times.
b. I didn't want to recompile my application or make changes to code.

I'd played around a bit with TPTP so I gave it a try and used it, it worked reasonably well, I eliminated some code that didn't cache data correctly , so all in all it was a success. I haven't had time to look through all the settings in detail , and I'm sure some of the settings are redundant , but they worked for me. I've created these steps using the latest available versions of TPTP/Eclipse.
I ran the test in Windows Vista. Folks using a different O.S. are probably smart enough to not need these steps.

Steps
a. Install Eclipse IDE for Java EE Developers

b. Install the TPTP(4.6.1) plugin. There are a set of screens on how to do this - http://wiki.eclipse.org/Install_TPTP_with_Update_Manager. You could also download the All in one which has Eclipse + TPTP. Also referred to a couple of links on TPTP. Profiling J2SE 5.0 based applications and TPTP installation guide

c. Download the agent controller for TPTP. Unzip it to a folder. Call this folder $AGENT_CONTROLLER_HOME

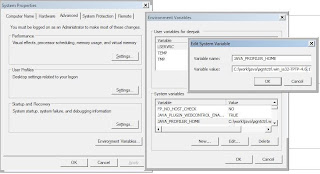
d. Set a new environment variable
JAVA_PROFILER_HOME=$AGENT_CONTROLLER_HOME\plugins\org.eclipse.tptp.javaprofiler


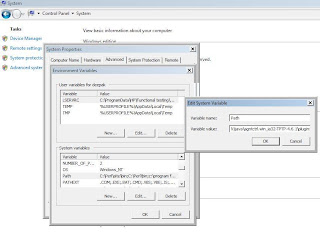
e. Set up the PATH ( I did this in Control Panel --> System --> Advanced --> Environment variables)
$AGENT_CONTROLLER_HOME\plugins\org.eclipse.tptp.javaprofiler;$AGENT_CONTROLLER_HOME\bin;
You should have Java in your path somewhere. I use the same JDK as that with BEA. (i.e. Java 1.5 . I did try Java 1.6, but it didn't work for me)


I run on Windows Vista so all command prompts are launched with Run As Administrator including the BEA server.

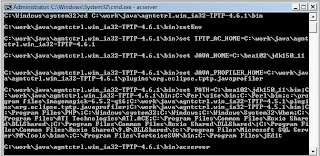
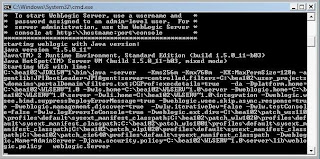
f. In a command window cd to $AGENT_CONTROLLER_HOME\bin and run setConfig. Specify the path to Java (1.5) and the other options, I chose the options in the screen below.


g. Start the agent controller (ensure no firewall blocking or unblock) by running acserver.exe.


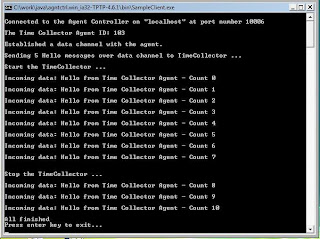
h. In a new command line window run SampleClient. If all is well, you should see the response. Close SampleClient command window but keep acserver running


Setting up BEA
i. Goto the BEA portal domain and change the following settings in setDomainEnv.cmd (these already exist , just change the values)
set debugFlag=false
set testConsoleFlag=false
set iterativeDevFlag=false
...
set PRODUCTION_MODE=true

Towards the bottom of the file (4-5 lines from the bottom), add the command to enable the profiler

set JAVA_OPTIONS=%JAVA_OPTIONS%
set JAVA_OPTIONS=-agentlib:JPIBootLoader=JPIAgent:server=controlled,filters=$DOMAIN_HOME\filters.txt;CGProf:execdetails=true %JAVA_OPTIONS%

Here we specify that the process should wait (server=controlled) till we connect to it, specify some filters for packages that we have no interest in (and which would cause the system to be slower), specify that we want to capture executing details.

Create a file named filters.txt in the path you have specified
org.apache.* * EXCLUDE
com.bea.* * EXCLUDE
weblogic.* * EXCLUDE
netscape.* * EXCLUDE
antlr.* * EXCLUDE
com.octetstring.* * EXCLUDE
com.rsa.* * EXCLUDE
org.omg.* * EXCLUDE
javelin.* * EXCLUDE
kodo.* * EXCLUDE
org.opensaml.* * EXCLUDE
com.pointbase.* * EXCLUDE
serp.* * EXCLUDE
com.solarmetric.* * EXCLUDE
schemacom_bea_xml.* * EXCLUDE
com.asn1c.* * EXCLUDE
com.certicom.* * EXCLUDE

When I hadn't filtered out kodo packages , I did get a ClassFormatError so at a minimum these packages must be filtered

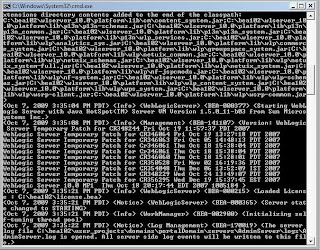
j. Now run startWeblogic. The process should wait(we specified server=controlled remember)


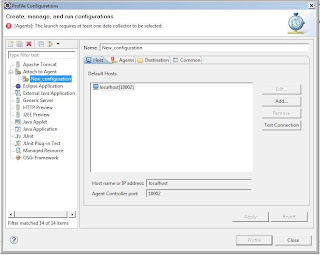
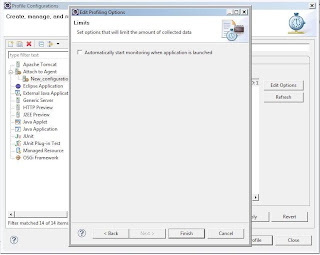
k. Now start eclipse. Click Run --> Profile Configurations. Click Attach to Agent and hit new icon. A new Configuration is created


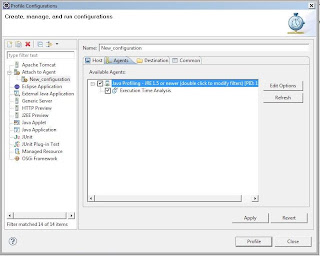
l. Now click the agents tab, if all is well you should be able to see an entry


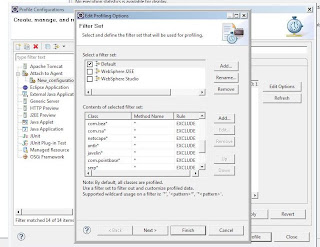
m. Double Click it and specify the filters (same as the ones specified in filters.txt)


n. Click Next, Uncheck the run automatically, Click finish.


o. Click Apply and Profile. Switch to the profile perspective.


We haven't started profiling yet, but the Weblogic server will now continue start up. You probably have to wait about 10 minutes.


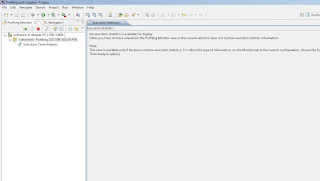
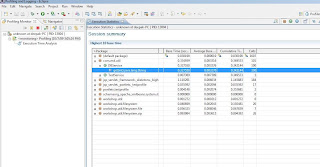
p. Once Weblogic is in running mode , you can start the profiling by clicking the run icon in the left pane. You can also click the execution statistics (though this might be empty since we have filtered most of the default BEA code that runs.


q. Now exercise your application by accessing it in the browser or by running a test e.g. a JMeter test.
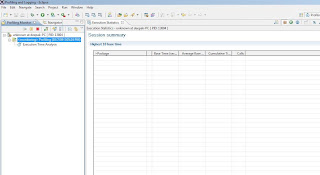
You should now be able to see execution details in Eclipse. For e.g.


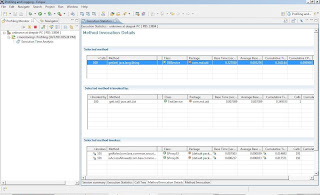
which shows 100 calls being made to DBService. Double click it.


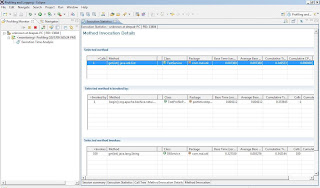
which shows the method calling it (TestService.getList() 1 call here makes a 100 calls to the DB , plus some BEA security checks). The TestService is called by the Portlet Controller as shown


And you can easily conclude that there is some sort of N+1 problem here. A single request leads to 100 db calls, after which inspect the code fix the problem, rerun the profile and verify that you only invoke the DB once.

However there is a caveat here, it is far far easier to profile your code out of container. If you can separate out your code so that most of it runs outside Weblogic , then it's easier to profile it. And as we all know, this isn't always possible.

Thursday, September 10, 2009

Running JMeter for a large number of concurrent threads

A common repeated question (Observation JMeter users probably don't use Google) on the JMeter forums goes something like
I need to run N000 users concurrently and I have a Windows/Unix/Mac with N GB RAM , will that work? or how do I run N000 users from JMeter or Im running N000 users concurrently against my server, am I performance testing this correctly?

And the correct answer is (like all things related to performance testing) , test it out and see for yourself. This doesn't mean that there aren't rule of thumb's that you can follow but that no one can give you a definitive answer.

My rules of thumb
  • Know the load your client machines can generate approximately(for your test) - On my Windows PC (with Vista and 3GB RAM, running JMeter with a heap of 1 GB, dual core 2.4GHZ) if I run more than 100 threads, my machine starts to hang. I can't use any other applications so I normally wouldn't run a single JMeter instance with > 100 threads for a machine configured like mine (But my tests usually don't have think times and delays). But this is a rule of thumb not a commandment. if I run Reliability and Performance monitor and check out the health of my PC , and I find it reasonably healthy then I can increase the threads, if not I'll reduce them. I also verify visually that the response time that JMeter seems to be giving me (by directly checking the JTL or CSV file being generated) is approximately the same as if I accessed the page(just the html using a proxy or browser sniffer) from a browser running on a different machine. We did have a case where a tester used LoadRunner to generate loads for 2000 users from a single machine which started giving him average response times of > 2 minutes but people who accessed the site saw response time of 15-20 seconds. The machine which was generating the load couldn't handle these many threads/sockets and was the bottleneck rather than the application being tested. This is also dependent on your test scripts and your application under test. Test scripts that have delays between requests will obviously be able to handle larger number of threads (because there wont be as many concurrent threads).
  • Run separate instances of JMeter (instead of master-slave) - Jmeter allows you to run a test in master slave mode (With 1..n slaves). The advantage of this that you get all the results at the master as well as the start times etc can be more or less synchronized. However the overhead has now increased , as well as the problem that supposedly this bit of JMeter is not designed too well. Its better to run separate instances of JMeter and combine the results (if CSV is chosen as the output file format, then this is as simple as file concatenation, if XML you need to do a little more work, but its easy as well). You could split up the test itself (e.g. 100 users browsing 100 users logging in could be split up into two jmeter tests) or run the same test with some threads per machine.
  • Run in command line mode, Disable all Listeners and preferably use CSV as your output format. Understand JVM options. JMeter is a java application , if you want the most out of your JMeter client you should run it light and you should know how to tune a java application (the Java Heap especially).
  • Understand your actual requirements. Far too often testers don't know the difference between logged in users and concurrent users. Or think times. Or how http works. Or how their app works. Or why input data to the test should be varied (our App cached data and try as we might we couldn't get the tester to understand that if all the concurrent users browsed the exact same page, everyone except the first user's will get really fast times). Second normal users take a lot of time to read a page, fill in form fields, pause between requests, drink a cup of coffee whatever, The number of user's with an active session is always greater than the number of user's actually doing something at the same time (and in a lot of cases far greater). Check your site with realistic (plus safety margin )numbers. If there are 100 concurrent users at peak times in your system then check with numbers close to it first before you want to test out 10,000 concurrent users
  • Performance testing goes hand in hand with tuning. Sometimes questions are asked of the sort 'I increased the load , I get SocketExceptions or the Applications responds very slowly , help!'. Well this is what you expect your test to tell you right? You now need to check why your application is responding slowly , using logs, profilers whatever. Rule of thumb tune , test, tune, test, tune, test, tune as often as you can.

Sunday, August 23, 2009

Performance Tuning tales

When you ask a J2EE guy something about performance tuning you'd probably get something that includes JVM tuning heap space, survivor ratio's , types of GC or you might get the don't use EJB , minimise the number of remote calls , or the use Hibernate , use Prepared Statements, use Cache etc etc. Interestingly enough for my current project we had implemented most of the above, tested it locally and seemed to get <4 second times for most pages. And we missed a big problem (hint it's a web based system) , can you guess?
The system responds in under 4 seconds when accessed locally. When accessed through a browser based in New York some (Can you guess?) requests take 20+ seconds. Luckily we did run external tests as soon as the production systems were available so we found this out a couple of months before the system was actually released.
In any case , in hindsight as soon as we knew the problem existed it was relatively easy to guess and verify(YSlow) the problems. We only had few small images so we knew the problem wasn't there.
a. Whats good for development isn't necessarily good for deployment. e.g. We do normally split CSS files , Javascript files and include them separately. Yes a browser will cache these files ( you do add Etags don't you?), but the first request and HTTPS will be slow if the browser must make these connections (normally at the most two at a time). - We used Yahoo and ANT to combine the CSS into one file and the Javascript into another (at build time) drastically reducing the response times
b. GZIP. Creating Gzipped versions of the files and dynamically gzipping all the content (a flag on the webserver) also brought down the times.
Just doing the above brought down the times to under 4 seconds even when the site was accessed remotely on limited bandwidth clients.
Moral of the story : Always test , never guess when it comes to performance tuning.

Wednesday, August 19, 2009

Testing

There are various kinds of test's that can be performed on a system , but it looks like most engineers don't agree on the definition of the test. For e.g. in my current project a 'unit test' tests out the end to end functionality but it must be performed by a developer i.e. any test that a developer performs is a unit test!
In any case this is my usage

Unit Test - Generally meant to represent that only a small subset of the code is under test. You might find a few fanatics who argue to the effect that anything that goes to the database isn't a unit test, anything that needs an external interface isn't a unit test etc etc. Ignore them. The key is that the test might not exercise the flow as it finally would. There might be mocked interfaces, hardcoded data. Generally written by developers and generally easier to automate. Unit tests are also low hanging fruit, and contrary to what most agile engineers will tell you, are pretty much useless expect to impress some manager with 'We have automated unit tests!' , 'We have continuous builds with JUnit reports!','We have 99% code coverage!'. The quality of these tests written is mostly poor (they are written by developers after all), the test data provided rarely covers boundary conditions, invalid data, exceptional conditions. Yes Yes I know you should have high code coverage. It's quite easy to game the high code coverage (which is what happens when metrics are imposed by management) but even if it wasn't, the code coverage is only as good as the code and the test.
e.g. function int add(int one, int two) {
return 4;
}
Test function with add(2,2), add(-1,5) , 100% code coverage , automated unit tests all green , mission accomplished!?
i.e. If the developer doesn't account for the boundary conditions in code, he isn't likely to test out those scenarios either.

Integration Test - Generally tests out the interface between multiple systems, though the data might be faked. If there are only two types of test that you can carry out on your system then this is one of them.
These tests are extremely hard to write (or atleast make it repeatable), and are very very useful. The earlier you can have these tests up and running on your system, the better the quality of your system. These tests are hard to write not because of technical problems(which exist) but because of people issues. Different systems are normally run by different teams (sometimes even external to your organisation) have their own schedules , develop at their own pace and make their own assumptions and are notoriously non co-operative. Technical limitations are normally due to non repeatable time sensitive data which either needs the data reset to a known state or data created from scratch.

Functional Test (End to End test). - Tests out functionality from a user's perspective. This is the second type of test that must be run and the earlier you can run these tests in your system the better the quality of the system is. Normally nothing is faked , actual data is used for the tests. When these tests are performed by a business user / stake holder these become Acceptance tests. These tests are extremely important and difficult to fully automate. e.g. These would also include UI tests (this page doesnt work on my browser!).

Performance/Load - Functional tests run in parallel (normally a good mixture) with varying concurrent users. Easy to do if the functional tests can be automated. In most cases difficult to simulate (especially if the system is already live, easier to do the first time). Depending on the duration you run this is also by different names. Some organizations refer to long running tests as smoke tests. (used to smoke out memory leaks) whereas some organisations use smoke tests to refer to some important functional tests that are run to check that no major errors exist.

System Tests - Used to check that all systems are up and running. Not really a test category by itself , but useful to abort test runs.

Wednesday, June 10, 2009

Fixing URLs

Motivation
For some tests, the URL to visit is extracted from the previous request using one of the PostProcessors (usually the Regex PostProcessor). However a URL containing parameters should normally have ampersands(&) escaped . This causes problems because JMeter will not automatically unescape these URL's

Solution
Use a javascript function to unescape the urls.

Sample
Assume that the Regex Post processor has extracted the url into a variable named returnUrl, then in the next HTTPSampler (Path field), instead of using ${returnUrl} use the function below.
${__javaScript('${returnUrl}'.replace(/amp;/gi\,''))}

This will simply replace amp; with a blank string so that a URL of the form http://www.yoursite.com/page?param1=value1&param2=value2 becomes
http://www.yoursite.com/page?param1=value1&param2=value2

Note that we don't need to do this for encoded values like %2F or whatever because that is taken care by the webserver

First Weblogic Portal Journeyman - WooHoo

Tuesday, June 09, 2009

Data DrivenTesting(from a database)

Motivation
Data to a test needs to be varied , however the input needs to be constrained to a set of values(normally in some database table). E.g. check the prices of the top 10 items. Here we need to provide 10 item ids , however if these values are kept in a CSV file , then the file needs to be repeatedly updated. There needs to be a way to get these values to the test at runtime

Solution
Use the JDBC Request Sampler to fetch the data at runtime. Use either the Save Responses to a file or a BeanShell post processor to write the data to a file. Finally use the CSV Data Set Config to read this data.

Sample

Sunday, June 07, 2009

Varying the data to the test

Motivation
The same test's need to be run, but the data we pass to it must be varied.
In addition further tests may need to change their behavior depending on the data. E.g. A user registering may provide different data , and subsequent screens may change depending on what the user has entered or may be skipped altogether. A common scenario is when a user registers to a site has various options he can choose from , and we need to test the behavior of the site for different combinations

Solution
JMeter provides multiple ways to vary the data
a. Use of User Parameters [1]
b. Use of Variables [2]
c. CSV Data Set Config [3]
The solution we will use is Option c.

The advantage of using CSV Data Set Config is that the data is externalised from the test , and can be updated by any user including a non technical business person. By making the assertion a part of the data, users can add more tests without needing the test itself to be modified. The other advantage of a CSV Data Set Config over a User Parameters pre processor is that the number of items that will be tested is fixed independent of the number of threads you will run (assuming you write the test in that fashion) OR can be made dependent on the number of threads. User Parameters is more closely tied to the number of threads.
e.g. If you wanted to create 10 distinct users , you'd only have 10 rows in your CSV data set config and you could use 1 to 10 threads. But if you needed to do this with User Parameters you'd probably need to specify exactly 10 threads.

So the solution takes the form of
a. Create a CSV Data Set Config element and point it to the CSV files.
b. Create your tests to use this data
If you want as many tests as you have rows in your CSV file, then you can either end the thread or use a Loop Controller an check for the special value ''<EOF>"


Sample

References
[1] User Parameters
[2] Variables
[3] CSV Data Set Config

Friday, June 05, 2009

Testing multiple environments with JMeter

Motivation
Most projects have a number of environments through which the code moves. e.g. A Development environment, A Test environment, A User Acceptance test environment, A reference environment and finally the Production environment. Hence the same test script is to be targeted to multiple environments. In theory all of this is automated , and anything that succeeds/fails in one environment would succeed/fail consistently in all other environments. However environmental differences and human errors almost always cause one to hear "But it works on my machine"
Whats needed is a way to run the same test against different environments easily
Solution
An assumption we are going to make here is that these tests are automated and would be run from the command line, in our case using ANT.
The solution has to address two basic requirements
a. Parameterization of the various environments
b. You should still be able to run the test in GUI mode (when you are modifying/extending the test)
To implement this we will use JMeter properties[1] and use normal ANT [2],[3] features.

While writing the HTTP tests, add an HTTP Request Default element

If the Server name or IP is to be varied then enter
${__property(run.server,,yourdevserver.com)}
This will look for a property named run.server , but will use yourdevserver.com if no property is specified. For the third parameter, use the server against which you want to run the test while running in GUI mode.

Finally in your Build Script that you use to run Jmeter

<jmeter jmeterhome=".." testplan="${run.test.plan}"

resultlog="${report.dir}/${run.test.report}-${run.env}-${DSTAMP}${TSTAMP}.jtl">

<property name="jmeter.save.saveservice.output_format" value="xml"/>

<property name="run.server" value="${run.server}" />

</jmeter>


where the ANT property run.server can be varied to run this against different environment.

Sample

TODO attach ant and jmx file.


References
[1] JMeter Properties
[2] JMeter Ant task
[3] Ant Manual

JMeter Prologue

I've been testing my existing work application using JMeter for the last 6 months , so what follows are a series of posts that I think isn't covered in most documentation or available online easily or in the same place (I had to figure out these solutions myself). However there is a caveat to that, the solution may not be the best possible one , may not be efficient and there may be more elegant ways to do what the solution does. In which case please inform me. However the solutions do have one thing in common, they worked for me. Your mileage may vary.

The rest of the post is a rant , feel free to move on
A few observations on a Friday(with a tip of the hat to BusyBee)


That people who keep asking for Unit Tests don't have a clue about testing web based applications.

That data driven integration testing between multiple systems is damn hard to do , but boy is it satisfying when you actually find a defect due to it, and boy is it worth your time to develop these tests.

That open source tools are so much better than some of the paid commercial tools. Except when it comes to presentation of the reports. Which surprisingly is also the difference between a Techie and a Manager.

That there still is no tool to truly perform visual tests on a website.
And That someone who could develop such a tool could make a lot of money.
And that someone wont be me.

That there is no time to test all the normal cases, much less the weird corner ones. and that there would always have been plenty of time in hindsight, if we had just gotten our act together earlier

That a successful test is the one that fails in local,development, test, QA , UAT environments. That a test thats succeeds in the above environments but fails on the production environment is a pain.

That a web based test should never underestimate the ignorance of a user.

That developers do not make good testers. And that most developers are better testers than the official testing team, especially when we test other developers code. And that scares me.

Thursday, April 30, 2009